This comprehensive 5-day training course is specifically tailored for researchers and analysts, aiming to elevate their ability to communicate complex data and findings clearly, accurately, and persuasively. The curriculum moves beyond basic charting to focus on the cognitive science, statistical integrity, and design principles necessary to create visualizations that accelerate insight and withstand academic scrutiny. Participants will learn how to select the right plot for the research question and execute powerful data graphics using industry-standard tools.
The training will cover fundamental design principles, effective plot choices for different data types (univariate, multivariate, time-series, geospatial), and the essential "Grammar of Graphics" framework. Key areas include techniques for communicating statistical uncertainty, creating engaging interactive dashboards, and visualizing the outputs of advanced statistical models (like regression and clustering). A strong emphasis is placed on ethical visualization practices and preparing high-quality, reproducible graphics suitable for journal publication and public presentation.
Who Should Attend the Training
· Academic Researchers and Scientists
· PhD and Graduate Students
· Institutional Research Analysts
· Data Journalists
· Biostatisticians
· Public Health Analysts
Objectives of the Training
1. Master the principles of effective visual communication based on cognitive science.
2. Select the most appropriate chart type to represent various data structures (categorical, quantitative, relational).
3. Utilize the "Grammar of Graphics" to construct and customize complex data visualizations systematically.
4. Effectively communicate uncertainty and statistical inference using confidence intervals and error bars.
5. Create advanced visualizations for specialized data types, including geospatial and high-dimensional data.
6. Design and implement interactive data dashboards for dynamic exploration of research findings.
7. Prepare publication-ready graphics that meet the technical requirements of academic journals (e.g., vector graphics, appropriate color schemes).
8. Identify and avoid deceptive or misleading visualization practices to maintain ethical reporting standards.
9. Apply visualization techniques to interpret and validate outputs from statistical models (e.g., model diagnostics, residuals).
Benefits of the Training
Personal Benefits
· Significantly improved communication of research findings to diverse audiences
· Faster path to publication by generating high-quality, compliant graphics
· Mastery of modern visualization tools (R/Python libraries) for reproducible results
· Increased confidence in presenting complex statistical concepts visually
· Development of a critical eye for evaluating the quality and ethics of data presentations
Organizational Benefits
· Higher impact research output due to clearer and more persuasive visual communication
· Standardization of high-quality data reporting across research teams
· Reduced time spent on manual graphic formatting for submission
· Improved internal decision-making through better data literacy and dashboarding capabilities
· Enhanced public and stakeholder engagement with research findings
Training Methodology
· Interactive lectures focused on design theory and statistical clarity
· Hands-on coding exercises using R (ggplot2) or Python (matplotlib/seaborn/plotly)
· Critique sessions where participants analyze and redesign existing research graphs
· Individualized project work focused on visualizing participant's own research data
· Continuous feedback and peer review to refine visual designs
Trainer Experience
Our trainers are expert data scientists and academic researchers who have successfully published extensive data-driven work in top-tier scientific journals. They possess practical mastery of both the statistical rigor and the design software required for high-impact visualization. Their deep experience in presenting data to both peer reviewers and the general public ensures that the training is focused on real-world, high-stakes communication.
Quality Statement
We are committed to delivering the highest quality visualization training. Our curriculum is continually updated with the latest in visual research and open-source tools. We guarantee a challenging, creative, and highly supportive learning environment that equips every participant to transform their raw data into compelling, truthful, and publication-ready narratives.
Tailor-made courses
We recognize that every organization has unique data and training needs. This course, while comprehensive, can be fully customized in terms of duration, depth of content, and specific industry data used for case studies. We offer bespoke solutions to align the training precisely with your team's objectives and current technical capabilities.
Course Duration: 5 days
Training fee: USD 1500
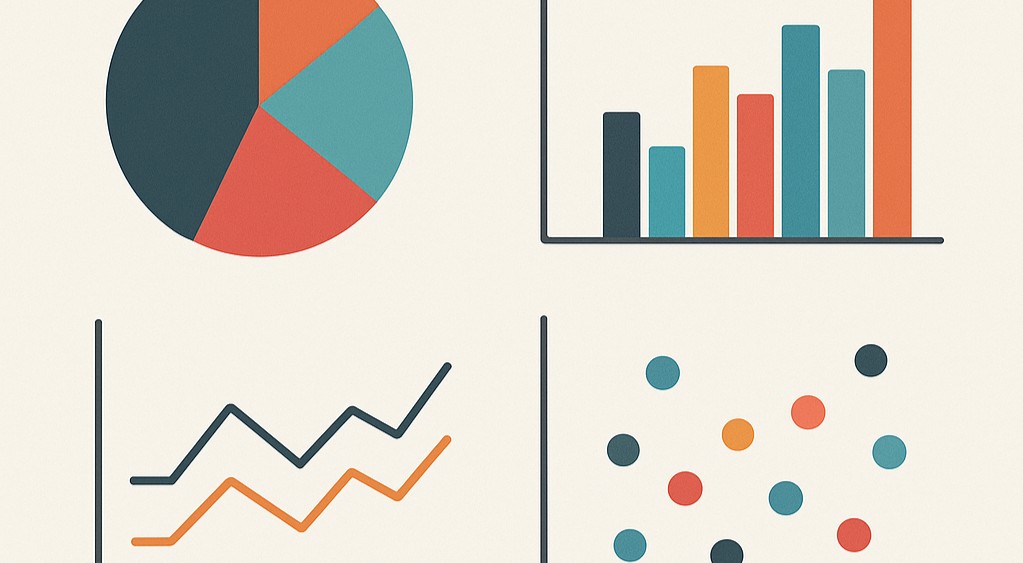
Module 8: Principles of Visual Perception and Cognitive Load
Requirements:
· Participants should be reasonably proficient in English.
· Applicants must live up to Armstrong Global Institute admission criteria.
Terms and Conditions
1. Discounts: Organizations sponsoring Four Participants will have the 5th attend Free
2. What is catered for by the Course Fees: Fees cater for all requirements for the training – Learning materials, Lunches, Teas, Snacks and Certification. All participants will additionally cater for their travel and accommodation expenses, visa application, insurance, and other personal expenses.
3. Certificate Awarded: Participants are awarded Certificates of Participation at the end of the training.
4. The program content shown here is for guidance purposes only. Our continuous course improvement process may lead to changes in topics and course structure.
5. Approval of Course: Our Programs are NITA Approved. Participating organizations can therefore claim reimbursement on fees paid in accordance with NITA Rules.
Booking for Training
Simply send an email to the Training Officer on training@armstrongglobalinstitute.com and we will send you a registration form. We advise you to book early to avoid missing a seat to this training.
Or call us on +254720272325 / +254725012095 / +254724452588
Payment Options
We provide 3 payment options, choose one for your convenience, and kindly make payments at least 5 days before the Training start date to reserve your seat:
1. Groups of 5 People and Above – Cheque Payments to: Armstrong Global Training & Development Center Limited should be paid in advance, 5 days to the training.
2. Invoice: We can send a bill directly to you or your company.
3. Deposit directly into Bank Account (Account details provided upon request)
Cancellation Policy
1. Payment for all courses includes a registration fee, which is non-refundable, and equals 15% of the total sum of the course fee.
2. Participants may cancel attendance 14 days or more prior to the training commencement date.
3. No refunds will be made 14 days or less before the training commencement date. However, participants who are unable to attend may opt to attend a similar training course at a later date or send a substitute participant provided the participation criteria have been met.
Tailor Made Courses
This training course can also be customized for your institution upon request for a minimum of 5 participants. You can have it conducted at our Training Centre or at a convenient location. For further inquiries, please contact us on Tel: +254720272325 / +254725012095 / +254724452588 or Email training@armstrongglobalinstitute.com
Accommodation and Airport Transfer
Accommodation and Airport Transfer is arranged upon request and at extra cost. For reservations contact the Training Officer on Email: training@armstrongglobalinstitute.com or on Tel: +254720272325 / +254725012095 / +254724452588
| Course Dates | Venue | Fees | Enroll |
|---|---|---|---|
| May 04 - May 08 2026 | Zoom | $1,300 |
|
| May 18 - May 22 2026 | Nairobi | $1,500 |
|
| Apr 06 - Apr 10 2026 | Nanyuki | $1,500 |
|
| Mar 02 - Mar 06 2026 | Mombasa | $1,500 |
|
| Apr 13 - Apr 17 2026 | Kigali | $2,500 |
|
| Apr 20 - Apr 24 2026 | Kampala | $2,500 |
|
| Oct 26 - Oct 30 2026 | Arusha | $2,500 |
|
| Jun 01 - Jun 05 2026 | Johannesburg | $4,500 |
|
| Jun 08 - Jun 12 2026 | Pretoria | $4,500 |
|
| May 11 - May 15 2026 | Cape Town | $4,500 |
|
| Jul 13 - Jul 17 2026 | Accra | $4,500 |
|
| Jun 22 - Jun 26 2026 | Addis Ababa | $4,500 |
|
| Sep 21 - Sep 25 2026 | Marrakesh | $4,500 |
|
| Dec 07 - Dec 11 2026 | Dubai | $5,000 |
|
| Sep 07 - Sep 11 2026 | Riyadh | $4,500 |
|
| Sep 14 - Sep 18 2026 | Doha | $4,500 |
|
| Jul 20 - Jul 24 2026 | Paris | $6,500 |
|
| Aug 17 - Aug 21 2026 | London | $6,500 |
|
| Sep 21 - Sep 25 2026 | Brussels | $6,500 |
|
| May 04 - May 08 2026 | Geneva | $6,500 |
|
| May 11 - May 15 2026 | New York | $6,950 |
|
| Apr 20 - Apr 24 2026 | Los Angeles | $6,950 |
|
| Jul 20 - Jul 24 2026 | Washington DC | $6,950 |
|
| Sep 07 - Sep 11 2026 | Toronto | $7,000 |
|
| Jul 06 - Jul 10 2026 | Vancouver | $6,950 |
|
Armstrong Global Institute
Typically replies in minutes